Glossary
Purchase Frequency
Purchase frequency measures how often a customer buys from a store within a defined time period. It's one of the three levers that determine customer lifetime value, alongside average order value and customer lifespan. Of the three, purchase frequency is usually the most actionable for a store owner, because well-timed communication moves it without touching pricing, product assortment, or the shopping experience itself.
The store-level calculation is simple enough.
Purchase frequency = total orders ÷ unique customers, across a defined period
If 1,000 customers placed 2,500 orders in a year, average purchase frequency is 2.5. But averages hide the distribution. That same 2.5 might be a small group of devoted shoppers buying monthly sitting next to a much larger group who bought once, in March, and were never heard from again. The average tells retailers something about their store. It tells them close to nothing about anyone in it.
The averages conceal that shape and that shape is where the money lives.
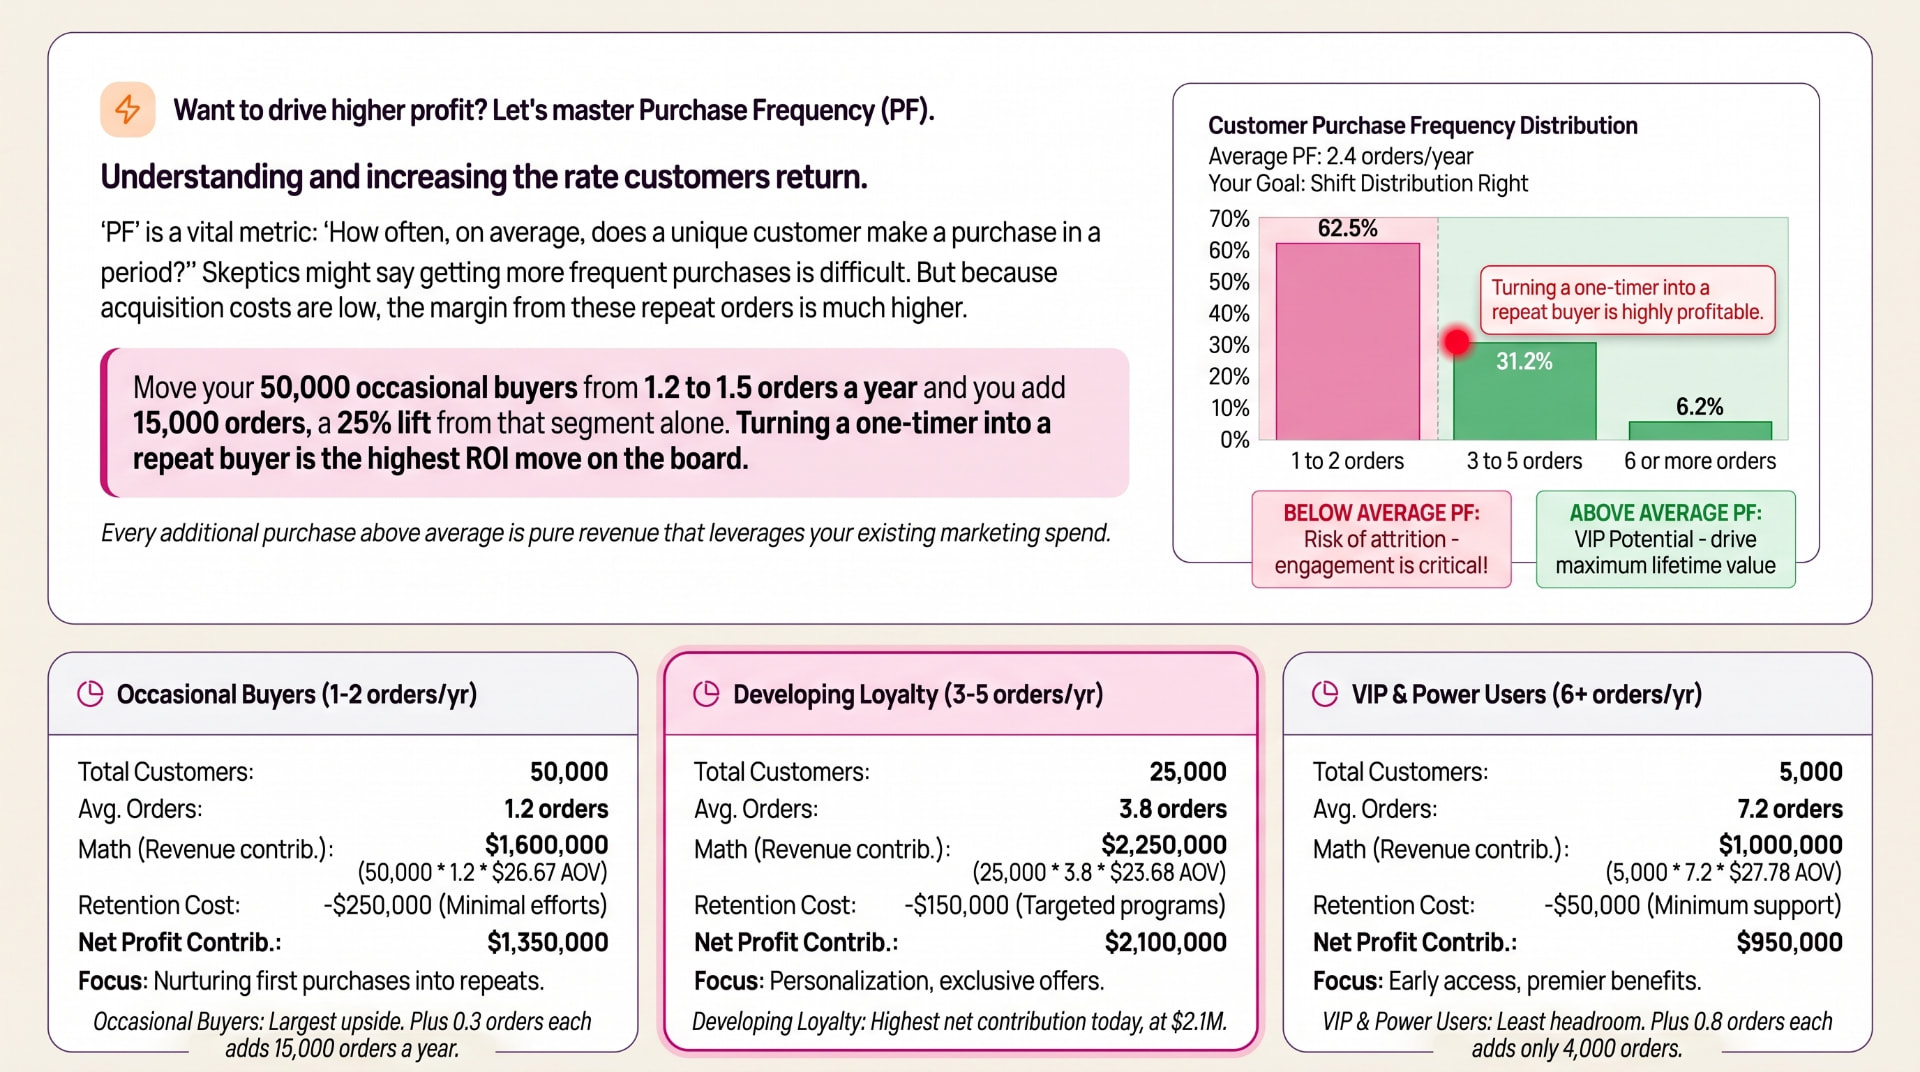
Model a store with 80,000 customers split three ways. Fifty thousand occasional buyers averaging 1.2 orders a year. Twenty-five thousand developing loyalty at 3.8. Five thousand power users at 7.2. Run the revenue and the middle tier contributes most, roughly $2.1 million net against $1.35 million from the occasional buyers and $950,000 from the power users.
Read the upside rather than the totals, though. Moving 5,000 power users from 7.2 orders to 8.0 adds 4,000 orders in a year. Moving 50,000 occasional buyers from 1.2 to 1.5 adds 15,000. The unglamorous segment holds the larger prize, and it holds it precisely because those shoppers are not on a subscription and nobody is reminding them.
For reorder automation, the individual number is the one that matters. How often does this person buy this product?
Individual purchase frequency = that customer's orders of one product ÷ the period measured
Someone getting through a bag of Ethiopian Yirgacheffe every 18 days sits somewhere different from someone who takes 35 days over the same bag of arabica coffee. Same product, same store, two caffeine fiends who need to hear from you at different times. Treat them identically, whether through a fixed subscription interval or a blanket campaign, and you have thrown away the one thing their data was actually good for.
Purchase frequency doubles as a diagnostic. Changes in one customer's frequency over time reveal shifts in engagement, satisfaction, or plain life circumstance. Accelerating frequency usually means growing loyalty. Decelerating frequency might mean a competitor, a tighter month, a house move, or ordinary drift. Reorder automation can answer both. Acceleration might warrant a loyalty offer or a recommendation. Deceleration might warrant an earlier reminder or a win-back sequence.
The Thing About Those Category Benchmarks.
Here is the point where most glossary entries hand you a tidy table and move along. Worth pausing first.
Published purchase frequency benchmarks are unusually unreliable, and a retailer calibrating against them should know why. There are three reasons. They are mostly reported blended across subscribers and non-subscribers, which is the largest single variable in the number. Many category figures are compiled from other published guides rather than measured directly, and some trace back to a 2019 retention dataset that keeps getting re-cited as current. And purchase frequency routinely gets confused with repeat purchase rate, which counts a percentage of customers rather than a number of orders, making the two not comparable at all.
With those caveats attached, the shape looks roughly like this.
| Category | Without a subscription | On subscription |
|---|---|---|
| Supplements and vitamins | 3 to 4 | 8 or more |
| Pet food and supplies | 3 to 4 | 8 to 12 |
| Coffee, food and beverage | 2 to 4 | 6 to 9 |
| Beauty and skincare | 2 to 4 | 4 to 7 |
| Apparel | 2 to 3 | Rarely applicable |
| Home goods and durables | 1 to 2 | Rarely applicable |
The columns matter more than the rows. Recharge reported subscribers averaging roughly 4.4 orders across a year in its 2024 subscriber trends report. Non-subscription buyers, blended across everyone including the majority who never return, sit closer to 1 to 1.5. Any benchmark that does not say which population it measured is not telling you enough to be worth using.
That gap is the entire argument for reorder automation, and it is also a warning about how to measure one. Reminders aimed at the shoppers who will not subscribe, judged against subscriber frequency, will make good work look like failure. The honest comparison is the same non-subscribing population before reminders and after.
Purchase frequency is the observable output. Consumption rate is the cause sitting underneath it, and predicted reorder windows are how a reorder agent turns one into the other. Move frequency and lifetime value moves with it, which is what keeps it the most workable of the three levers.